Code
import yfinance as yf
import matplotlib.pyplot as plt
import pandas as pd
# Fetch data
qqq = yf.Ticker('QQQ')
spy = yf.Ticker('SPY')
qqq_hist = qqq.history(period='max', interval='1wk')
spy_hist = spy.history(period='max', interval='1wk')
spy_hist = spy_hist.reindex(qqq_hist.index)
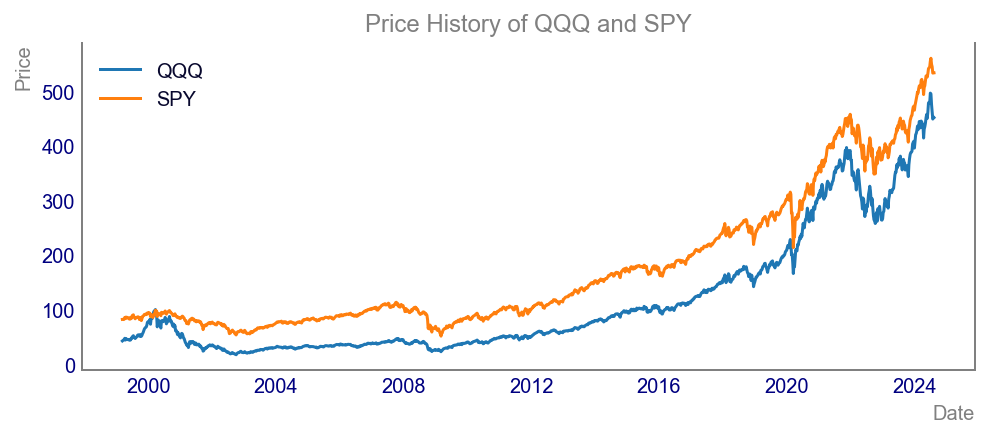
# Plotting price history
plt.style.use('getting_started-chart.mplstyle')
fig, ax = plt.subplots()
ax.plot(qqq_hist.index, qqq_hist['Close'], label='QQQ')
ax.plot(spy_hist.index, spy_hist['Close'], label='SPY')
ax.set_title("Price History of QQQ and SPY")
ax.set_xlabel("Date")
ax.set_ylabel("Price")
ax.legend()
plt.show()